The Actions Menu appears to the
right of the Go button on the Search bar. Use this menu to customise an interactive
report.
 action menu
Used to modify the columns displayed.
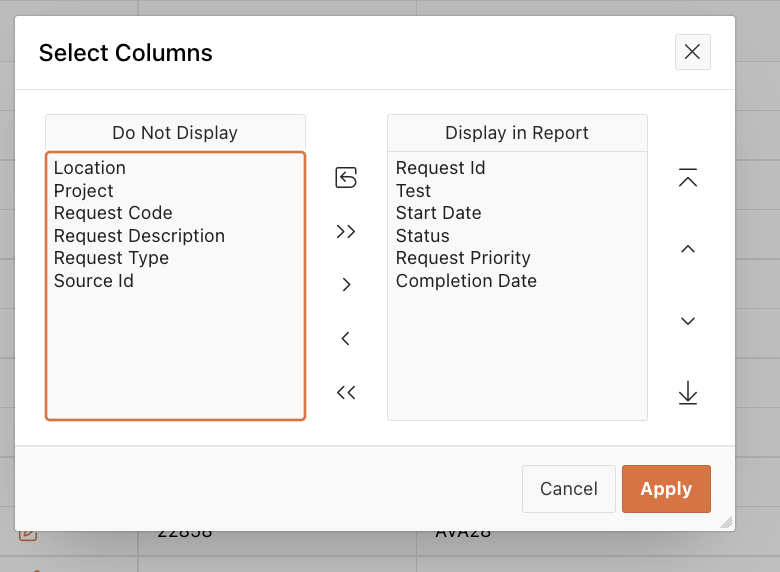 Columns
You can
reorder the displayed columns using the arrows on the far right. Computed
columns are prefixed with **.
Filter
Focuses the report by adding or modifying
the WHERE clause on the query. You can filter on a column or by row.
When filtering by column
Select a column
(it does not need to be one that displays), select a standard Oracle operator
(=, !=, not in, between), and enter an expression to compare against.
Expressions are case sensitive. Use % as a wild card (for example, STATE_NAME
like A%).
When filtering by row
Complex WHERE clauses can be created using column aliases and any Oracle functions or
operators (for example, G = 'VA' or G = 'CT', where G is the alias for
CUSTOMER_STATE).
DATA
Sort
This function is used to change
the columns to sort on and determines whether to sort in ascending or
descending order.
You can also specify how to handle NULLs. The default setting
always displays NULLs last or always display them first.
The resulting sorting
displays to the right of column headings in the report.
Aggregate
Aggregates
are mathematical computations performed against a column.
Aggregates display
after each control break and at the end of the report within the column they
are defined.
Options include:
Aggregation enables you to select a
previously defined aggregation to edit.
Function is the function to be
performed (for example, SUM, MIN).
Column is used to
select the column to apply the mathematical function. Only numeric
columns display.
Compute
Enables you to add computed columns to your
report.
These can be mathematical computations (for
example, NBR_HOURS/24) or standard Oracle functions applied to existing
columns. Some display as examples and others (such as TO_DATE) can also be used).
Options include:
Computation enables you to select a previously defined computation to edit.
Column Label is the column heading for
the new column.
Format Mask is an Oracle format mask to be applied against the column (for
example, S9999).
Computation Expression is the computation to be performed. Within the computation, columns
are referenced using the aliases displayed.
Below computation, the columns in your query
display with their associated alias. Clicking on the column name or alias
includes them in the Computation. Next to Columns is a keypad. This keypad
functions as a shortcut to commonly used keys. On the far right are Functions.
The following example computation
demonstrates how to display total compensation:
CASE WHEN A = 'SALES' THEN B + C ELSE B END
(Where A is ORGANIZATION, B is SALARY and C
is COMMISSION)
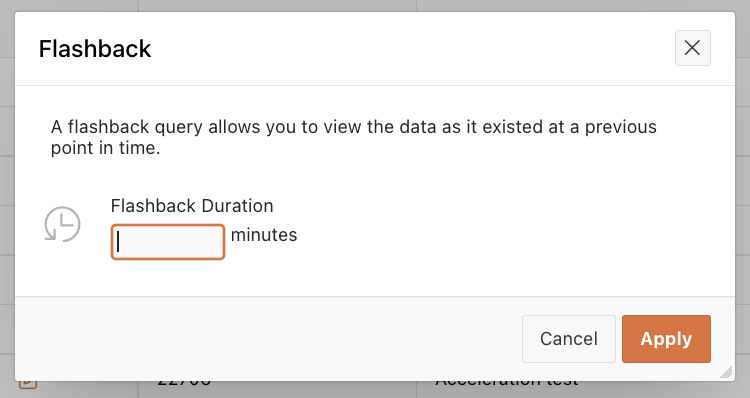
Flashback
A
flashback query enables you to view the data as it existed at a previous point
in time.
The default amount of time that you can flashback is 3 hours (or 180
minutes)
Format
enable you to customise the display of the report.
Used to create a break group on one or several
columns. This pulls the columns out of the interactive report and displays them
as a master record.
Enables you to define a filter. The rows
that meet the filter criteria display as highlighted using the characteristics
associated with the filter. Options include:
Name is
used only for display.
Sequence identifies the sequence in which the rules are evaluated.
Enabled identifies if a rule is enabled or disabled.
Highlight Type identifies whether the row
or cell should be highlighted. If Cell is selected,+the
column referenced in the Highlight Condition is highlighted.
Background Colour is the new colour for
the background of the highlighted area.
Text Colour is the new colour for the text in the highlighted area.
Highlight Condition defines your filter condition.
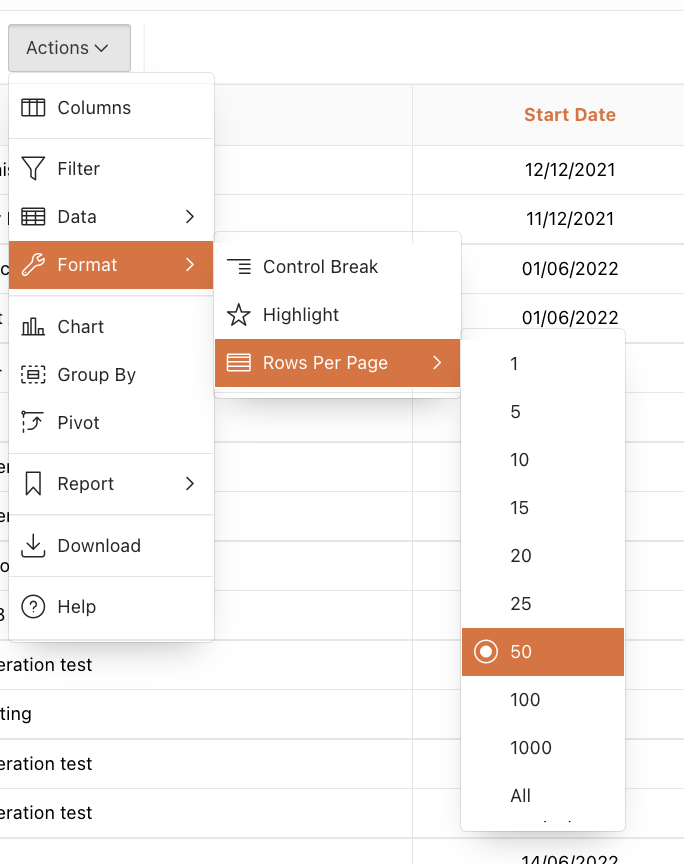
Row per page
Sets the
number of records to display per page.
Chart
You can define one chart per saved report.
Once defined, you can switch between the
chart and report views using view icons the Search bar. Options include:
Chart Type identifies the chart type to include. Select from horizontal bar,
vertical bar, pie, or line.
Label enables
you to select the column to be used as the label.
Axis Title for Label is the title that
displays on the axis associated with the column selected for
Label. This is not available for pie chart.
Value enables
you to select the column to be used as the value. If your function is a COUNT,
a Value does not need to be selected.
Axis Title for Value is the title that
displays on the axis associated with the column selected for
Value. This is not available for pie chart.
Function is an optional function to be performed on the column
selected for Value.
Sort allows
you to sort your result set
Group by
You can define one Group By view per saved
report. Once defined, you can switch between the group by and report views
using view icons on the Search bar. To create a Group By view, you select:
The columns on
which to group
The columns to
aggregate along with the function to be performed (average, sum, count, etc.)
You can define one Pivot view per saved
report. Once defined, you can switch between the pivot and report views using view
icons on the Search bar. To create a Pivot view, you select:
The columns on which to pivot
The columns to display as rows
The columns to aggregate along with the function to be performed
(average, sum, count, etc.)
Save Report
Saves
the customised report for future use.
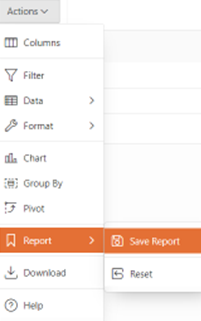
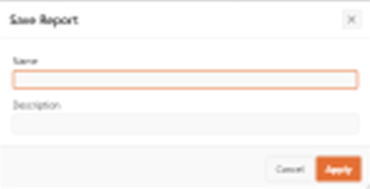
provide a name and optional description
and can make the report accessible to the public (that is, all users who can
access the primary default report).
four types of interactive
reports can be saved:
Primary Default (Developer Only). The
Primary Default is the report that initially displays. Primary
Default reports cannot be renamed or deleted.
Alternative Report (Developer Only).
Enables developers to create multiple report layouts. Only
developers can save, rename, or delete an Alternative Report.
Public Report (End user). Can be saved,
renamed, or deleted by the end user who created it. Other users can
view and save the layout as another report.
Private Report (End user). Only the end
user that created the report can view, save, rename, or delete the
report.
A saved customised reports, a Reports
selector displays in the Search bar to the left of the Rows selector
If you customise an interactive report, the report settings display below the Search bar and above the report. This area can be collapsed and expanded using the icon on the left.
For each report setting, you can:
Edit a setting by clicking the name.
Disable/Enable a setting by unchecking or checking the Enable/Disable check box. Use this control to temporarily turn a setting off and on.
Remove a setting by clicking the Remove icon.
If you have created a chart, group by or pivot, you can toggle between them and the base report using the Report View, Chart View, Group by View, and Pivot View links shown on the right. If you are viewing the chart, group by or pivot, you can also use the Edit link to edit the settings.
Resets
the report back to the default settings, removing any customisations that you
have made.
Enables the current result set to be
downloaded.
The download formats differ depending upon your installation and
report definition but may include CSV, HTML, Email, XLS, PDF, or RTF.
Help
Click on
the “Help” menu to open a guide for the users directly from Optima